The following code records how I load csv files to R and run hierarchical clustering algorithm on the data. I have to say that using R to plot the data is extremely EASY to do!
> df <- read.csv("C:/Users/Creek/Desktop/data.txt", row.names=1,head=FALSE, sep=",")
> d <- dist(as.matrix(df))
> hc <- hclust(d)
> plot(hc)
> q() |
In the read.csv method, row.names=1 specifies the first column is name/label, not data of variables. head=FALSE specifies the is on head data.
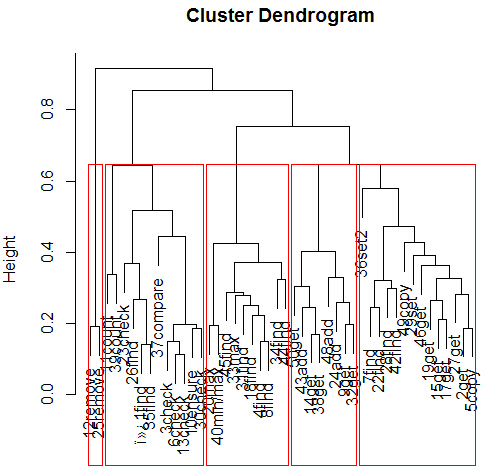
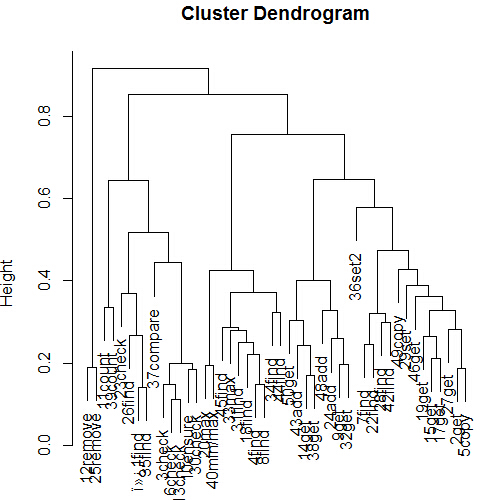
Here is a cluster dendrogram:
You can also cut the cluster at some height. You can cut by specifying the number of clusters by using:
rect.hclust(hc, k=5, border="red") |
or you can cut by setting the height:
rect.hclust(hc, h=0.5, border="red") |